
This post is from the ‘Showing My Workings’ section: Lil bits and pieces from what I've been doing or thinking about, that aren't complete or meaty enough to post to main blog. If you don’t want to get ‘Showing My Workings’ posts emailed to you, just click unsubscribe down the bottom of this email and then, on the page that comes up, to the right of ‘Showing My Workings’ click the ‘stop getting emails’ button.
As I mention a lot on this blog, I track my happiness using experience sampling. Then I can use this data to see what activites etc. correlate with me feeling better or worse. This week I got curious to see this kind of data for larger groups of people beyond myself, so I did a little Google for experience sampling studies of happiness, and I’ll share just a couple of things here I found interesting from just one of the studies (Hopefully I’ll share some stuff from the others in future, and may or may not end up writing a full post talking about stuff from all the different studies and my personal data).
What Experience Sampling Is And Why I Wanted To Find Experience Sampling Happiness Data
Experience sampling is an experimental method in which you ‘ping’ participants at random times throughout their days (e.g. using an app) and ask them questions about their thoughts/feelings/behaviour/environment etc in that moment. This has a lot of advantages over traditional survey methods. For example, say you are trying to find out how often people think about sex. You could just give them a survey and say “how often do you think about sex?”. This would be a decent way of doing it, but when answering one of these surveys we’re probably just not that great at accurately remembering and calculating about ourselves exactly how many minutes in our average day are spent thinking about sex. So the experience sampling approach would be to instead, over say a few week period, ping your study participants at random times with an alert saying “When this ping went off were you thinking about sex?”. Then you can see what percentage of the alerts got a ‘yes’ answer, and… bingo! You’ve got much more reliable data on how often people actually think about sex!1
So I wanted to find studies which used experience sampling to ask people how good/bad they were feeling in the moment, as well as other questions about what they were doing, and looked at correlations. (e.g. On average did study participants feel happier when alone or with others?). Obviously as we all know, correlation does not imply causation, so for example we could imagine, for the sake of argument, that being alone could be correlated with being less happy, but that could (potentially) just be because when people are sad they want to be alone, and not because being alone is causing people to feel sad. (That’s just an example). Despite this kind of limitation, it still seems very interesting and informative to me to see this kind of data.
One study: Csikszentmihalyi and Hunter, 2003
I found it surprisingly hard to find experience sampling studies of happiness! Reliable data on what correlates with happiness seems like such useful data that I assumed there’d be heaps of studies. But in maybe 15 mins of Googling I only found four different studies (one of which had two separate samples) (Obviously fifteen minutes of Googling is not an exhaustive search though). The four are listed at the bottom of this post, if you know of any others please let me know! In this post I’ll just share a couple things I found interesting from just one of these four studies, Csikszentmihalyi and Hunter, 2003. I might write about the others another time. Remember not to take too much from just a single study.
This study looks at 828 United States school students (between 6th and 12th grade) across the United States. They were taken from the Alfred P. Sloan Study of Youth and Social Development, which Google tells me was run from 1992-1997.
Okay so let’s start with the table listing how average happiness varied with different activities in the sample, cos that’s what I was most curious to see.
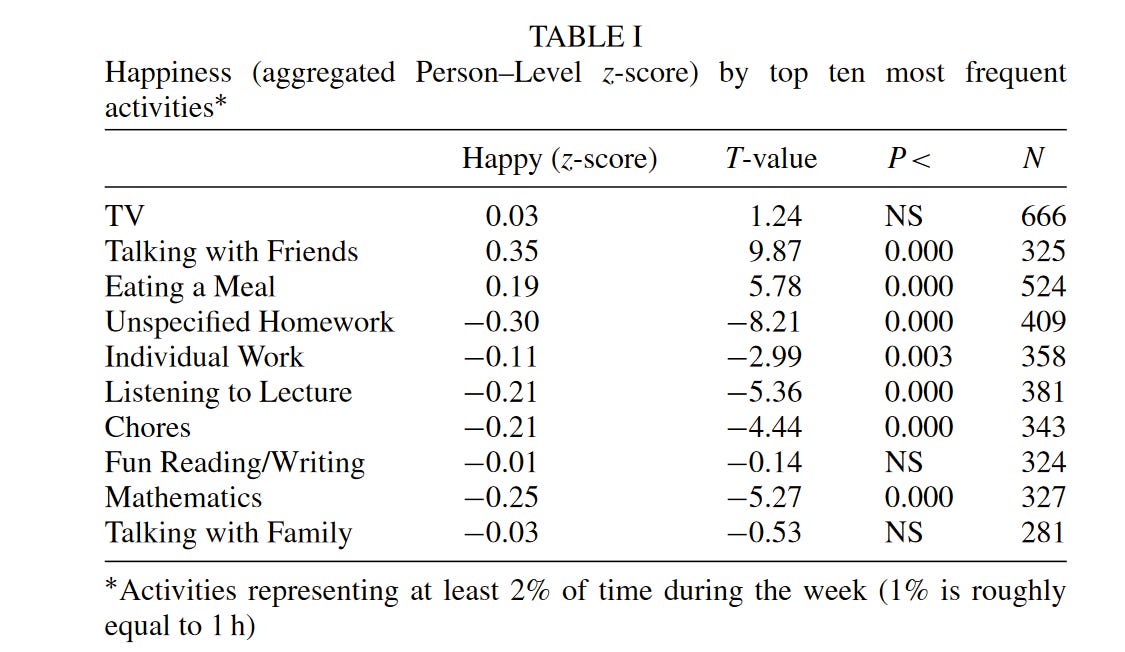
The column to look at in this table is “Happy (z-score)”. The numbers in that column tell you, for example, how much happier were people when watching TV on average, compared to the overall average happiness level in the study. So positive numbers for an activity mean happier than average, and negative numbers mean less happy than average. (If you’re curious, the units are standard deviations of the whole sample, so a z-score of 1 means 1 standard deviation above mean happiness). This is based on their answers in the moment to how happy-to-sad they were on a 7 point scale, and what main activity they were doing.
This table only shows the ten most common activities, I wish they’d included all of them!
You can see that the happiest activity is talking with friends, and the lowest is unspecified homework ☹️ I was kind of surprised by how high ‘eating a meal’ is, but this surprisingly lines up with my own personal data! I had also gotten surprised when I saw how high the happiness levels were for eating in my personal data, and thought it was maybe some weird thing specific to my circumstances, so it was cool to see it showing up in this larger sample too. I’m guessing that apart from the eating itself, eating also often comes with along with “taking a break” (e.g. lunchtime) and possibly hanging out with friends.
One thing they don’t show in the table (as it’s not in ten most frequent activities), but do mention in the text is that sports had a happiness z-score of 0.5, which is higher than anything on the table by far.
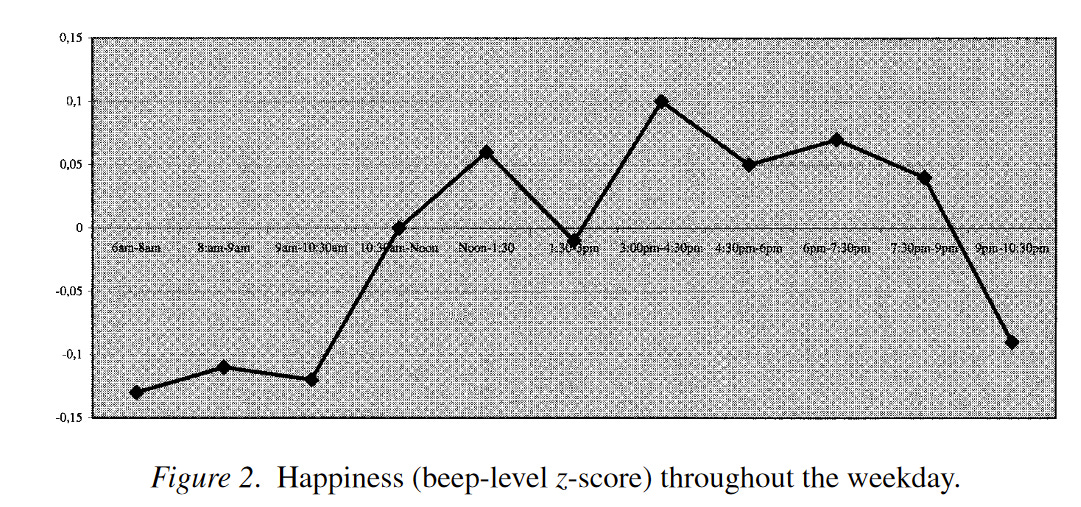
They also looked at how average happiness varied with different days of the week and times of day. Saturday (start of the weekend!) was highest, Sunday or Monday was lowest (I’m confused about this, as the text and a graph seem to say different things about which is lower, and they say the Sunday data on this wasn’t reliable enough because of less responses and higher variance in happiness). That classic ‘oh no it’s already school tomorrow’ slump, I’m guessing? As for times of day, looking at school days you can see in the graph below: lower happiness in morning, popping up for lunchtime then back down, and then up again around the end of the school day, staying up through arvo and early evening before dropping down again later at night.
They also looked at how average happiness varied on the person level with different demographic characteristics. e.g. based on all this experience sampling data, did older students on average report greater happiness than younger students? Out of all the demographic variables they looked at (age, gender, social class of the student’s community, Ethnic background), the strongest demographic effect (not necessarily causal) came from social class of the community. Interestingly though, it wasn’t that students from the richest communities were happiest and those from poorest communities were least happy. The study ranked communities’ affluence into five categories from Poor (call it 1/5) to Upper Class (5/5). The highest happiness reports actually came from working class communities (2/5), followed by middle class (3/5), then poor (1/5), then upper class (5/5), and finally with the lowest reported happiness, upper middle class (4/5). This ordering is very surprising and interesting to me, but I haven’t taken the time to look into it more or think about what/how much to make of it. (For those interested, the p-value on the ANOVA for demographic variables had p < 0.0001 for social class of community).
There’s also this vaguely tragic sentence: “Happiness decreases through the teenage years; it reaches its lowest point by age 16, and then shows a small recovery by age 18.”
One interesting fact they point out is that, while studying (homework etc) is correlated with lower happiness in the moment, students who spend more time studying are happier on average. This is the type of detail that an experience sampling study can pick up but which might be hard for other forms of studies to pick up. If this result seems confusing/contradictory, think of it like this for analogy: I’d probably expect adults are less happy when they’re working, but also that adults who spend no time working (unemployed) are less happy overall than adults who spend more time working (employed).
List Of The Four Experience Sampling Happiness Studies I’ve Found So Far
The one I talked about here:
Mihaly Csikszentmihalyi and Jeremy Hunter, ‘Happiness in Everyday Life: The Uses of Experience Sampling’, Journal of Happiness Studies 4, no. 2 (1 June 2003): 185–99, https://doi.org/10.1023/A:1024409732742
Other three, I might write something about in future:
Jongan Choi, Rhia Catapano, and Incheol Choi, ‘Taking Stock of Happiness and Meaning in Everyday Life: An Experience Sampling Approach’, Social Psychological and Personality Science 8, no. 6 (1 August 2017): 641–51, https://doi.org/10.1177/1948550616678455.
Waratchaya Putsiri and Panuwat Sajjaviriyakul, ‘SUBJECTIVE WELLBEING OF BANGKOK CITIZENS USING THE EXPERIENCE SAMPLING METHOD’, 20 August 2021, https://doi.org/10.5281/zenodo.5440213.
Mihaly Csikszentmihalyi and Maria Mei-Ha Wong, ‘The Situational and Personal Correlates of Happiness: A Cross-National Comparison’, in Flow and the Foundations of Positive Psychology: The Collected Works of Mihaly Csikszentmihalyi, ed. Mihaly Csikszentmihalyi (Dordrecht: Springer Netherlands, 2014), 69–88, https://doi.org/10.1007/978-94-017-9088-8_5.
Obviously this way of doing it isn’t perfect either, but it seems much more reliable than survey data.