

How did trying Lavender Oil (Silexan) go for my anxiety?
An update

TL;DR: I tried Silexan for anxiety for four weeks. My subjective impression was that it probably didn’t really do anything but hard to tell, so I stopped taking it. Then for this post today I made a graph of my mood tracking data and the graph looks like there actually was a positive mood change that lined up with the time I was taking it.
Back in May I wrote about how I was starting to try out the off-the-shelf medication Silexan (which is just lavender oil processed in a particular way), as a treatment for anxiety, after reading Scott Alexander’s post about it:

In my post in May I wrote about Scott’s post:
he describes how the studies so far on Silexan show strong effects on anxiety — better than SSRIs, which are a current frontline medication for anxiety. (I tried SSRIs last year but they didn’t work for me. That doesn’t mean you shouldn’t try them though if you haven’t, they have very different effects for different people). Scott says that a “very reputable professional publication within psychiatry” (his words, I trust him) , The Carlat Report, has recently published positively about Silexan, […]
But Scott notes that it’s early days because only six studies have been done so far and all but one of them have been run by the same researcher.
Scott’s summary of the evidence, along with the fact that it has very minimal side effects (most notably burps that smell like lavender), was enough to get me to try it for myself.
I promised to follow up here on the blog three weeks later with my results, and I’m a bit late but here’s the followup.
As I’ve mentioned before in other posts, I track my mood with ~10-times-daily experience sampling: At random times, about 10 times per day, an app on my phone beeps at me and I enter how good/bad I’m feeling at that moment. So one source of data on how Silexan might have worked for me or not is to just look at how my mood tracking data changed after I started taking Silexan.
So let’s have a look at that data, but first a caution. This kind of data is super unreliable when just looking at one person trying something for one period. It’s super easy for the data to be messed up by other unrelated factors. For example, say I coincidentally happened to have a really stressful assignment due around the time I started taking Silexan— then the data would show low moods before taking Silexan, going up after taking Silexan, but it would just be a coincidence.
That kind of problem is is what researchers would call a problem of low ‘internal validity’ — i.e. Does the data lead to valid conclusions about the participants in the study (in this case, me)? It would be possible to improve the internal validity by, for example, rolling a die to randomly choose four months out of the year for me to take Silexan, and then looking at the data on all four months vs the other months of the year. This would reduce the chance that other mood-changing events happened to coincide with all four of these random months. (Though still it’s not that reliable with just four, depending on how strong of an effect you see).
But even if you fix the internal validity, there’s another even bigger problem with looking at data from one person— it’s likely to have very low external validity. i.e. Even if I perfectly work out the true effect Silexan had on me, that doesn’t tell you much about other people external to this data, i.e. about people other than me. Most psychotropic medications affect different people differently, so knowing how something effects one person doesn’t tell you much about how it will effect other people. That’s part of why good studies use many participants (another reason is it gives better internal validity because the random coincidences wash out).
So for both of these reasons, don’t let these data decide whether or not you try Silexan for yourself. Base that on a critical look at the current wider-scale state of the evidence on Silexan.
Graphs, yay!
So, the spoiler alert is that after about four weeks I didn’t think I’d seen any significant change from Silexan and so I stopped taking it. That was about three weeks ago.
BUT
Then today I was writing this post and so I plotted my mood data on a graph and—
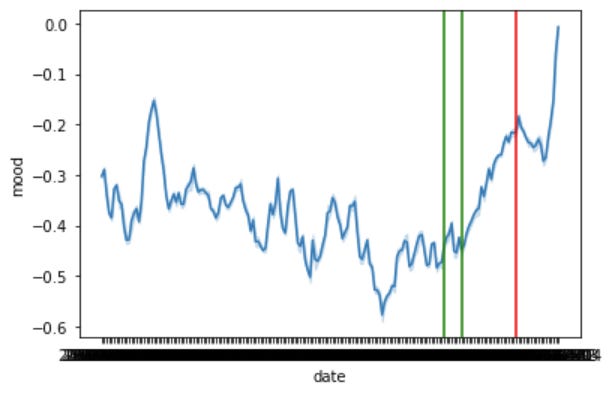
The y-axis is my mood on a -3 to +4 scale1 (actually, to smooth out the graph it’s the exponentially weighted moving average of my mood). The x-axis is time. The first green line is when I started taking Silexan, and the second green line is a week after that (Reports vary on how long it takes to have an effect, but one source says about a week). The red line is when I stopped taking it.
So um…. that kinda looks very much like my mood went consistently up starting a week after I started taking Silexan, continued upwards until I stopped taking it, and then just after I stopped taking it my mood dropped again? (The steep slope right at the far right end of the graph is when I went to Stone Soup experience design camp for six days— let this be an ad for that).
I mean, just eyeballing a graph is always risky, and if I was better at statistics I would crunch some numbers rather than just eyeballing it, but that sure doesn’t look like “I didn’t really see any change in my mood” to me…
So I guess… maybe…. I was wrong? And I actually should still be taking it?
One confounding factor is that around the same time I started taking Silexan I also started trying out a new ‘way of looking’ at the world, which was to focus on how free will is an illusion and so we can see things as ‘fate’. I was reading a bunch of stuff about this, thinking about it a lot, making up little exercises to drive it home for myself, and I think all that brought me some relief and more peacefulness (less time spent beating myself up for/worrying about doing the wrong thing).
I also answered the DASS-21 questionnaire, a questionnaire for assessing levels of depression and anxiety, a few times over the time I was taking Silexan.

That’s a graph of my anxiety and stress scores (the DASS-21 splits anxiety into physical symptoms, ‘anxiety’, and mental/emotional symptoms, ‘stress’)
I started Silexan on 19th May and took it for last time on 17th June, which is after the last time I took the DASS and so off the graph, so the results here are ambiguous but it looks like my stress score rose a little. I trust this data less the the mood-tracking data though, because the DASS data is just me sitting down to take a questionnaire and trying to remember how I felt over the last week, whereas the mood-tracking is done in the moment. On the other hand though, the mood-tracking isn’t specific to anxiety whereas the DASS is.
So… I think what I might do is choose some random date over the next month or two to start taking Silexan again, and see if the mood data shows the same upward pattern when I try it that second time.
Specifics of what I took
I bought the Seremind brand of Silexan. I took two capsules per day because Scott’s post mentioned that in at least some of the studies that higher dose of 160mg/day showed higher effect sizes. This is not medical advice though lol, as the packaging says to take one per day (80mg).
My first day taking it was the 19 of May, and last day was 17th of June. According to my medication app I missed 2 days over that time.
Also just so you know, some people report that after stopping Silexan their anxiety gets worse than usual for a very short period (I think people said like two or three days, from memory? I can’t remember where I read this now sorry), so I do wonder if it might be worth tapering off when you finish, to minimise chances of this (e.g. going down from two to one per day, then one every second day etc). I don’t know if this would help or not, I’m not a doctor, but I know this is the protocol for things like SSRIs which have ‘discontinuation effects’ (‘withdrawals’ to their enemies) like this. Personally I don’t think I got this ‘anxiety bounceback’ effect, or least not in a very big way.
Yes I know that’s a weird scale, there are Reasons